전체 글 708

데이터 시각화 (그래프 그리기)#pandas#numpy

# [도수분포표] import pandas as pd import numpy as np # drink 데이터 drink = pd.read_csv("drink.csv") # 전체 참석 횟수를 확인하는 도수분포표 drink_tab = pd.crosstab(index = drink["Attend"], columns = "count") print("전체 참석 횟수를 확인하는 도수분포표") print(drink_tab) #누가 몇 번 참석했는지 알 수 있는 도수분포표 drink_who = pd.crosstab(index = drink["Attend"], columns = drink["Name"]) print("누가 몇 번 참석했는지 알 수 있는 도수분포표") print(drink_who) # [원형 그래프] im..

자료의 형태

1. 수치형 자료 : 실수로 측정이 가능한 자료형 (키, 몸무게, 시험점수, 나이) (1) 연속형 자료 : 원주율, 시간, 키, 몸무게 등.. (2) 이산형 자료 : 시험점수, 나이, 동영상 조횟수 등.. 2. 범주형 자료 (1) 명목형 척도(nominal) : 구분할 수 있는 척도 (ex 혈액형, 성별) (2) 서열 척도 (ordinal) : 순서 관계를 밝혀주는 척도 (등수, 직위, 학력) (3) 등간 척도 (interval) : 덧셈 뺄셈이 가능한 척도, 배는 불가능 (섭씨 화씨온도, 시간) (4) 비율척도 (ratio): 비율로도 계산이 가능한 척도 (절대온도, 성적, 키, 무게, 인구수, 길이 수량 등등)

나이브베이즈 분류 #나이브 베이즈#확률통계

1. 나이브 베이즈 확률 def main(): sensitivity = float(input()) prior_prob = float(input()) false_alarm = float(input()) print("%.2lf%%" % (100 * mammogram_test(sensitivity, prior_prob, false_alarm))) def mammogram_test(sensitivity, prior_prob, false_alarm): p_a1_b1 = sensitivity # p(A = 1 | B = 1) p_b1 = prior_prob # p(B = 1) p_b0 = 1-prior_prob # p(B = 0) p_a1_b0 = false_alarm # p(A = 1|B = 0) p_a1 = p..

회귀분석 #사이킷런#넘파이#numpy#scikit-learn

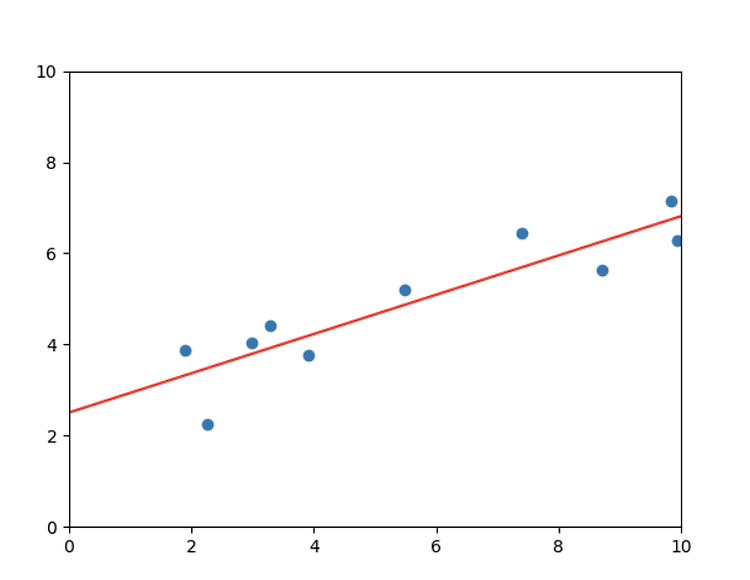
1. 점찍기 x,y점들을 matplot라이브러리를 이용하여 점찍기 # [점그리기] import matplotlib.pyplot as plt import numpy as np # 1. x,y값 X = [8.70153760, 3.90825773, 1.89362433, 3.28730045, 7.39333004, 2.98984649, 2.25757240, 9.84450732, 9.94589513, 5.48321616] Y = [5.64413093, 3.75876583, 3.87233310, 4.40990425, 6.43845020, 4.02827829, 2.26105955, 7.15768995, 6.29097441, 5.19692852] plt.scatter(X, Y) # (x, y) 점그리기 plt.show(..

깃허브에 파일 올리기

1. 깃 시작 (init) cmd창에서 프로젝트 디렉토리로 이동후 git에게 현재 디랙토리에서 힛 작업을 할 것이라고 알림. git init git init을 하면 .git파일이 생성됨 .git 파일 속에는 버전에 대한 정보가 저장되어 있음. 2. git이 버전을 추적할 파일 추가 (add) git add를 통해 수정한 파일을 커밋 대기상태로 만든다. 이를 "스테이지 상태에 있다"고 한다. 이후 commit을 수행하면 스테이지 상태에 있는 파일들이 커밋 되는것이다. git add {파일이름} (해당 디렉토리의 모든 파일을 추가하고 싶으면 git add .) (example) 1. git status 를 통해서 현재 어떤 파일들이 git이 추적하고 있는지를 확인할 수 있다. 2. f1.txt파일을 git ..

CLI/깃허브 2020.06.28

[RNN] LSTM으로 감성분석

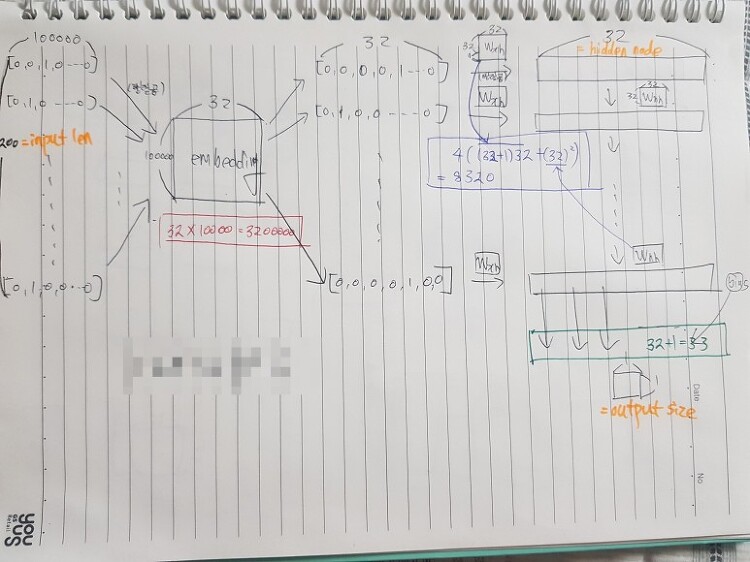
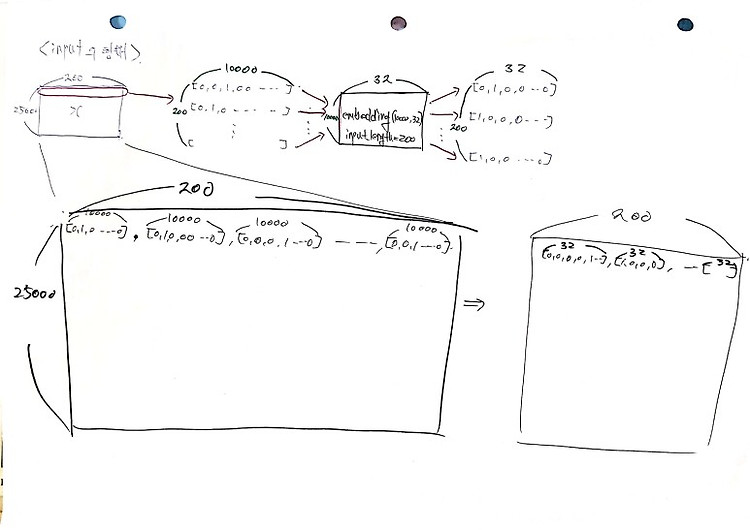
1. tensorflow kerasimport tensorflow as tffrom tensorflow.keras import layersfrom tensorflow.keras.datasets import imdbfrom tensorflow.keras.preprocessing import sequence 2. 최대 단어 개수와 길이# 최대 단어의 개수max_features = 10000 # 최대 단어 길이 (한번의 인풋당 들어갈 단어의 수)maxlen = 200 # num_word : 빈도가 높은 상위 max_features개 단어만 사용함.# skip_top : 빈도가 높은 상위 단어 0개 제외(input_train, y_train), (input_test, y_test) = imdb.load_da..

CNN으로 MNIST 분류

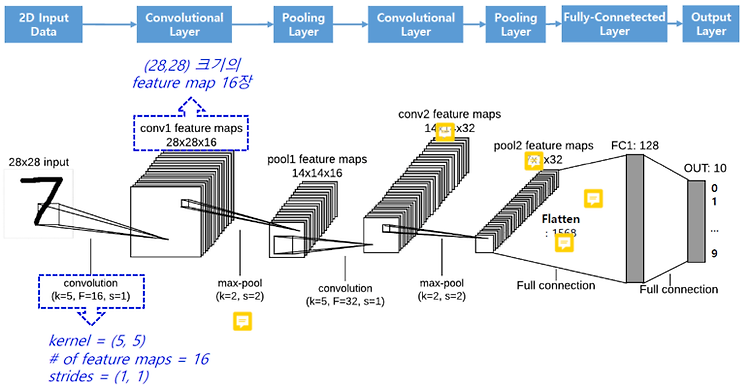
1. 데이터 전처리import tensorflow as tffrom tensorflow.keras import layers, utilsfrom tensorflow.keras.datasets import mnistnum_classes = 10; epochs = 10; batch_size = 100learning_rate = 0.1; dropout_rate = 0.5# input image dimensionsimg_rows, img_cols = 28, 28# data loading(x_train, y_train), (x_test, y_test) = mnist.load_data()#각차원의 크기를 튜플형태로 반환하는 변수 x_train.shapeinput_shape = (img_rows, img_cols, 1..

학습된 CNN모델에 직접 사진 test하기

1. 필요 모듈, 함수 구성import numpy as npfrom PIL import Imageimport matplotlib.pyplot as plt# jpg 이미지를 숫자로def jpg_image_to_array(image_path, size): # open image image = Image.open(image_path) # resize (클수록 선명하지만 느릴 수 있다) image = image.resize((size, size)) # convert to int ndarray im_arr = np.fromstring(image.tobytes(), dtype=np.uint8) # 모양확인 변수 .shape print(im_arr.shap..

DNN(MLP)으로 MNIST 분류

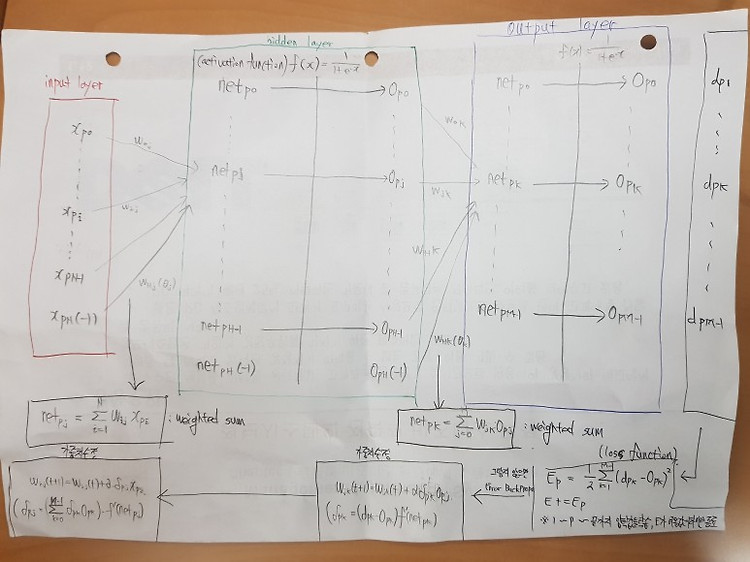
1. 데이터 전처리import tensorflow as tffrom tensorflow.keras import layers, utilsfrom tensorflow.keras.datasets import mnist# data loading(X_train, y_train), (X_test, y_test) = mnist.load_data()# 60000*(28*28) -> 60000*(784) (28*28 2차원 metrix를 784 1차원으로 바꿈)X_train = X_train.reshape(60000, 784)# float로 바꿈X_train = X_train.astype('float32')X_test = X_test.reshape(10000,784).astype('float')# data를 0과 1사이..

DNN(MLP, FFN)으로 iris 구분

1. 데이터 전처리import numpy as npimport pandas as pdimport tensorflow as tffrom tensorflow.keras import layers # 같은 디렉토리에 iris.csv파일 불러오기csv = pd.read_csv("iris.csv")# 판다스의 csv모듈X = csv[["sepal_length", "sepal_width","petal_length","petal_width"]].as_matrix()# 클래스 레이블 (one hot coding용)bclass = {"Iris-virginica":[1,0,0], "Iris-setosa":[0,1,0], "Iris-versicolor":[0,0,1]}y = np.empty((150,3)) # i는 ..

DNN을 이용한 회귀분석

1. 파일 읽기import numpy as npimport pandas as pdfrom pandas import ExcelFileimport tensorflow as tffrom tensorflow.keras import layers #모듈(변수나 함수를 포함)만 불러오기from sklearn.preprocessing import StandardScaler, MinMaxScaler #표준 정규화, 최대-최소 정규화#df = pd.read_excel('File.xlsx', sheetname='Sheet1') #sheet명도 지정할 수 있음df = pd.read_excel('Real estate valuation data set.xlsx')print(df.columns)*print() :Index(['..

keras 함수적 구현

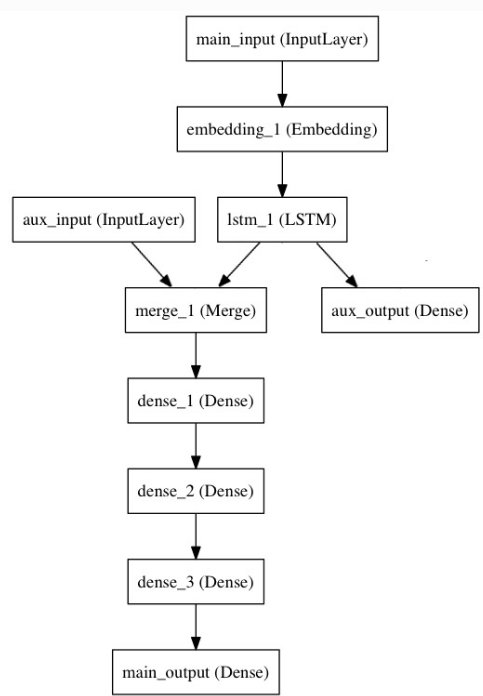
https://keras.io/ko/getting-started/functional-api-guide/​keras를 sequential이 아닌 함수적으로 구현함으로서 모델 내에 input과 output을 조정한다.from keras.layers import Input, Densefrom keras.models import Model# input값의 차원을 의미(att의 개수와도 같다)inputs = Input(shape=(784,))# 레이어 인스턴스는 텐서에 대해 호출 가능하고, 텐서를 반환x = Dense(64, activation='relu')(inputs)x = Dense(64, activation='relu')(x)predictions = Dense(10, activation='softmax')..