
반응형
1. 이항분포
# [이항분포]
import numpy as np
import matplotlib.pyplot as plt
import scipy as sp
from scipy import stats
# 이항분포 생성
n, p = 10, 0.3
stat_bin = sp.stats.binom(n, p)
# 그리기
fig, ax = plt.subplots()
#확률밀도함수
x_axis = np.arange(n + 1)
plt.bar(x_axis, stat_bin.pmf(x_axis))
plt.show()
fig.savefig("pmf_plot.png")
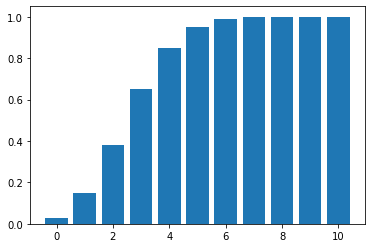
#확률질량함수
x_axis = np.arange(n + 1)
plt.bar(x_axis, stat_bin.cdf(x_axis))
plt.show()
fig.savefig("cdf_plot.png")
# [랜덤표본 추출]
# 반복값 동일하게 설정
np.random.seed(seed = 0)
## 랜덤 샘플 추출 (10번 추출해서 몇번나오는지 확인을 50번함)
random_bin = np.random.binomial(n = 10,p=0.3, size = 50)
print(random_bin)
## 평균계산
bin_mean = np.mean(random_bin)
print(bin_mean)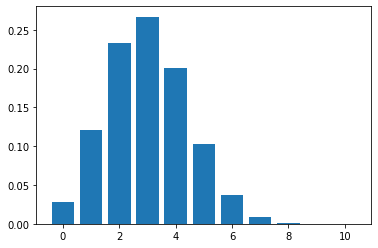
[3 4 3 3 3 3 3 5 6 3 4 3 3 5 1 1 0 4 4 5 6 4 3 4 1 3 1 5 3 3 2 4 3 3 0 3 3
 3 5 4 2 3 4 1 4 4 2 1 2 2]
3.08
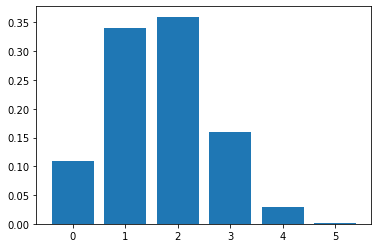
2. 초기하분포
# [초기하분포]
import numpy as np
import matplotlib.pyplot as plt
import scipy as sp
from scipy import stats
# 30개의 물건(정상25개, 불량품5개일)중 10개를 추출했을 때 불량품의 개수별 확률?
[M, n, N] = [30, 5, 10]
stat_hyp = sp.stats.hypergeom(M, n, N)
# 그리기
fig, ax = plt.subplots()
## pmf를 만드는 코드를 작성해 주세요
x_axis = np.arange(n+1)
plt.bar(x_axis, stat_hyp.pmf(x_axis))
plt.show()
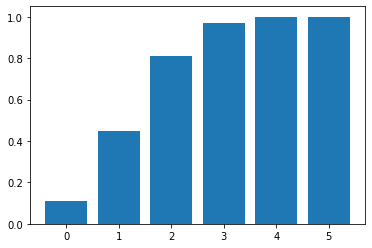
# Q2. 초기하분포 cdf 그리기
## cdf 만드는 코드를 작성해 주세요
x_axis = np.arange(n+1)
plt.bar(x_axis, stat_hyp.cdf(x_axis))
plt.show()
# Q3. 랜덤표본 추출
## seed 설정 seed = 0
np.random.seed(seed = 0)
## 랜덤 샘플 추출
random_hyp = np.random.hypergeometric(ngood = 5, nbad= 25, nsample=10, size = 50)
## 평균계산
hyp_mean = np.mean(random_hyp)
print(hyp_mean)
1.76
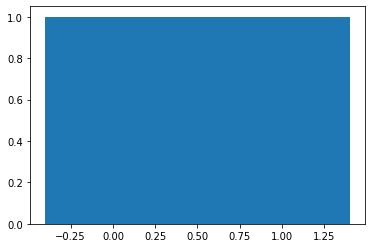
3. 균일분포
# [균일분포]
import numpy as np
import matplotlib.pyplot as plt
import scipy as sp
from scipy import stats
stat_uni = sp.stats.uniform()
# 그리기
fig, ax = plt.subplots()
## pdf를 만드는 코드를 작성해 주세요
x_axis = np.linspace(0, 1, 100)
plt.bar(x_axis, stat_uni.pdf(x_axis))
##
plt.show()
fig.savefig("pdf_plot.png")
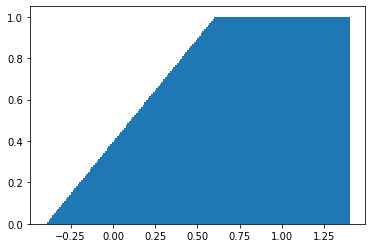
# Q2. 균일분포 cdf 그리기
## cdf 만드는 코드를 작성해 주세요
x_axis = np.linspace(0, 1, 100)
plt.bar(x_axis, stat_uni.cdf(x_axis))
plt.show()
fig.savefig("cdf_plot.png")
# Q3. 균일분포 샘플링
np.random.seed(seed = 0)
## 샘플 추출
random_uni = np.random.uniform(0,1,100)
print(random_uni)
## 평균 계산
uni_mean = np.mean(random_uni)
print(uni_mean)
[0.5488135  0.71518937 0.60276338 0.54488318 0.4236548  0.64589411
 0.43758721 0.891773   0.96366276 0.38344152 0.79172504 0.52889492
 0.56804456 0.92559664 0.07103606 0.0871293  0.0202184  0.83261985
 0.77815675 0.87001215 0.97861834 0.79915856 0.46147936 0.78052918
 0.11827443 0.63992102 0.14335329 0.94466892 0.52184832 0.41466194
 0.26455561 0.77423369 0.45615033 0.56843395 0.0187898  0.6176355
 0.61209572 0.616934   0.94374808 0.6818203  0.3595079  0.43703195
 0.6976312  0.06022547 0.66676672 0.67063787 0.21038256 0.1289263
 0.31542835 0.36371077 0.57019677 0.43860151 0.98837384 0.10204481
 0.20887676 0.16130952 0.65310833 0.2532916  0.46631077 0.24442559
 0.15896958 0.11037514 0.65632959 0.13818295 0.19658236 0.36872517
 0.82099323 0.09710128 0.83794491 0.09609841 0.97645947 0.4686512
 0.97676109 0.60484552 0.73926358 0.03918779 0.28280696 0.12019656
 0.2961402  0.11872772 0.31798318 0.41426299 0.0641475  0.69247212
 0.56660145 0.26538949 0.52324805 0.09394051 0.5759465  0.9292962
 0.31856895 0.66741038 0.13179786 0.7163272  0.28940609 0.18319136
 0.58651293 0.02010755 0.82894003 0.00469548]
0.4727938395125177
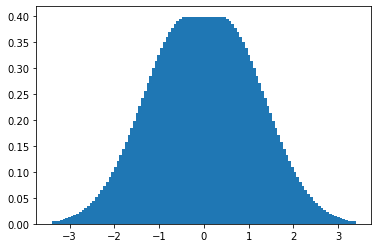
4. 정규분포
# [정규분포]
import numpy as np
import matplotlib.pyplot as plt
import scipy as sp
from scipy import stats
stat_nor = sp.stats.norm(0,1)
# Q1. 정규분포 확률밀도함수
fig, ax = plt.subplots()
x_axis = np.linspace(-3, 3, 100) # -3에서 3까지 구간에서 100개의 숫자를 동일한 크기만큼 뽑아주는 함수
plt.bar(x_axis, stat_nor.pdf(x_axis))
plt.show()
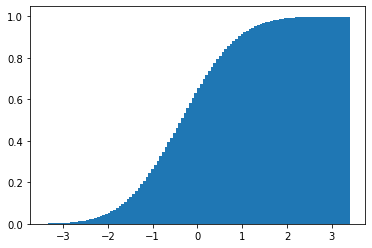
# Q2. 정규분포 cdf 그리기
## cdf 만드는 코드를 작성해 주세요
x_axis = np.linspace(-3, 3, 100)
plt.bar(x_axis, stat_nor.cdf(x_axis))
plt.show()
# Q3. 정규분포 샘플링
## seed 설정
np.random.seed(seed = 0)
## 샘플 추출
random_nor = np.random.normal(0,1,100)
print(random_nor)
## 평균 계산
nor_mean = np.mean(random_nor)
print(nor_mean)
[ 1.76405235  0.40015721  0.97873798  2.2408932   1.86755799 -0.97727788
  0.95008842 -0.15135721 -0.10321885  0.4105985   0.14404357  1.45427351
  0.76103773  0.12167502  0.44386323  0.33367433  1.49407907 -0.20515826
  0.3130677  -0.85409574 -2.55298982  0.6536186   0.8644362  -0.74216502
  2.26975462 -1.45436567  0.04575852 -0.18718385  1.53277921  1.46935877
  0.15494743  0.37816252 -0.88778575 -1.98079647 -0.34791215  0.15634897
  1.23029068  1.20237985 -0.38732682 -0.30230275 -1.04855297 -1.42001794
 -1.70627019  1.9507754  -0.50965218 -0.4380743  -1.25279536  0.77749036
 -1.61389785 -0.21274028 -0.89546656  0.3869025  -0.51080514 -1.18063218
 -0.02818223  0.42833187  0.06651722  0.3024719  -0.63432209 -0.36274117
 -0.67246045 -0.35955316 -0.81314628 -1.7262826   0.17742614 -0.40178094
 -1.63019835  0.46278226 -0.90729836  0.0519454   0.72909056  0.12898291
  1.13940068 -1.23482582  0.40234164 -0.68481009 -0.87079715 -0.57884966
 -0.31155253  0.05616534 -1.16514984  0.90082649  0.46566244 -1.53624369
  1.48825219  1.89588918  1.17877957 -0.17992484 -1.07075262  1.05445173
 -0.40317695  1.22244507  0.20827498  0.97663904  0.3563664   0.70657317
  0.01050002  1.78587049  0.12691209  0.40198936]
0.059808015534485
5. 가설검정
import numpy as np
import scipy as sp
from scipy import stats

# 모평균 가설검정
## 1) seed 설정 seed = 0
np.random.seed(seed = 0)

## 2) 샘플 추출
# 평균100, 시그마5, 표본10
random_nor = np.random.normal(100,5,10)
print(random_nor)

# 평균 계산
nor_mean = np.mean(random_nor)
print(nor_mean)

## 3) 모평균 가설 검정 함수 정의
def ztest(stat, mu, sigma):
    z = (stat.mean() - mu) / (sigma*np.sqrt(len(stat)))
    return (2 * (1-sp.stats.norm.cdf(z)))

## 4) 모평균 가설 검정
mu_test = ztest(random_nor, 100, 10)
print(mu_test)
[108.82026173 102.00078604 104.89368992 111.204466   109.33778995
  95.1136106  104.75044209  99.24321396  99.48390574 102.05299251]
103.69011585364417
0.9071043604301807
반응형